General Tips before getting an AWR Report.
1.
Collect Multiple AWR Reports: It's
always suggested to have two AWR Reports, one for good time (when database was
performing well), second when performance is poor. This way we can easily
compare good and bad report to find out the culprit.
SQL> select
* from dba_hist_wr_control;
DBID
SNAP_INTERVAL RETENTION TOPNSQL
---------- ---------------------- ------------------------ -- -----------
169052300 +00000 00:30:00.0 +00090 00:00:00.0 50

DB Time= session time spent in database.
DB Time= CPU Time + Non IDLE wait time.
Example: Suppose there are 5 active sessions present on the
database which are executing some long running queries.
Now consider
the duration of 5 Minutes i.e.
Elapsed Time = 5 Min.
In this case
what will be the DB Time?
As 5 active
Sessions are executing queries for the entire duration of 5 Minutes, my DB Time will be 25 Min.
General Example :-
Where’s The Milk ?
• My son kindly pops down to the local shop to buy some milk.
A full 60 minutes later, he finally returns and plops the milk on the kitchen bench.
• This “response time” is clearly unacceptable, I needed the milk within 5 minutes…
So how do I improve the response time ?


It is not always CPU bottleneck or CPU issue in oracle server if DB CPU is high in AWR Report. Do your math before jump into conclusions. Through sqlplus or OEM you can generate AWR report as snapshot. In Top 5 Timed Forground events, you will see
Time(s) in second.Now go to Operating System Statistics, and you will see BUSY_TIME, IDLE_TIME, NUM_CPUS.

Calculation:
DB CPU=3150
NUM_CPUS=4
Snapshot time= 1 hrs= 60 mins
Formula:
Total CPU: NUM_CPUs * snapshot_time * 60(secs)
= 4 X 60 X 60 secs
=14,400 secs
Out of 14400 secs cpu time, only 3150 sec cpu time has been used.
% used= (3150/14400)x100
= 21 % busy.
In this case CPU is not busy at all. But in case CPU is busy say above 80% , you can go “SQL ordered by CPU Time” reports and find the sql ID that makes CPU DB busy. When you find sql ID that is taking high cpu resources, you can tune the sql query performance.
========================================================================
What Elapsed Time, DB Time and DB CPU represent in AWR report and how to calculate Wait time (Non-Idle)
Elapsed Time - Elapsed time is the time what a user experiences when running a query. When looking into AWR report, the Elapsed Time is the wall clock time of duration for which AWR report has been generated. For example, if we generate AWR report for 1 hour then Elapsed Time in AWR report will be 60 mins.
DB CPU - DB CPU is the CPU consumption by all Oracle server processes/foreground processes during snapshot interval time. The name DB CPU has been taken from statistic name which is found in the view v$sys_time_model.
SQL> select stat_name, value from v$sys_time_model where stat_name='DB CPU'
2 /
STAT_NAME VALUE
------------------------------ ----------
DB CPU 974752790
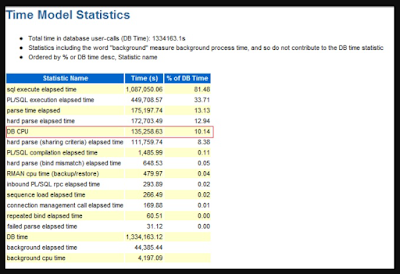
If we look at any AWR report, we will find DB CPU statistic value in "Time Model Statistics" Section. The value reported in the AWR report represents total CPU consumption by all Oracle server processes during the snapshot interval time. This statistic value is converted into seconds in AWR report.

How to calculate Wait Time (Non-Idle) -
When any Oracle process is not consuming CPU, it will be paused. This time, when a process is not consuming CPU is termed as wait time. The wait time can also be categorized in idle wait time and non-idle wait time. If a process is waiting for something to complete, then it is considered as non-idle wait time. There are lots of idle and non-idle wait events in Oracle database. So, as a DBA, to improve the database performance, we need to focus on non-idle wait events. In the following screenshot, we can see that in my system there are 94 idle wait events.

So the DB time is sum of DB CPU and Non-Idle wait time.
DB Time = DB CPU + Non-Idle wait time
so, Non-Idle wait time = DB Time - DB CPU
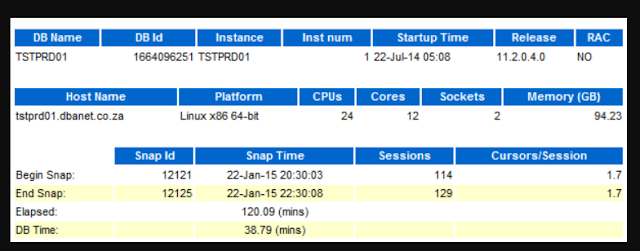
Begin Snap and End Snap: The start and stop times of the analysis period
Elasped : Represents the time between the two snapshots.
DB TIME: Represents the activity on the database - time to answer user calls
Database time
= sum (User response time) Time model
= sum (CPU time + Wait time) Event model
DB time links the resource consumption with user response time.
- DB TIME > Elapsed Time => Database has high workload
- DB TIME >> Elapsed Time => Things are waiting
Database load - How application was busy on doing database calls?
= DB time/Elapsed
= 38.71/120.09
= 0.32 (a.k.a average active sessions)
SCENARIO
CPUs: 12 Cores: 2 Sockets: This host has 12 cores.
Accordingly, in a 60 minute hour we have 60 X 12 = 720 CPU minutes
Therefore, for 2 hours we have 1440 CPU mins.
However, we used only 39 CPU mins - only 39/1440 = 2.7% of all available CPU on the box!
If the host was CPU bound DB, you would probably see DB CPU more like 900 - 1000 mins
Usually it indicates:
- Contention for latches
- SQL statements doing too many logical I/Os
- Lots of parsing due to the application not using bind variables
CURSORS/SESSIONS: If the number of Cursors/Session at the End Snap is greater than that at Begin Snap then we may have a cursor leak.
Review logons in the Load Profile and sessions in the initialization parameters.
NB: Open_cursors is per session and it does not have a DB-wide scope. Look at v$open_cursors
Look out for lock and session leakage.
================================================================================
1)
Load Profile
This section is one of the most important section in AWR Report. Because You can find out load of database from DB Time, Transactions, Hard Parse, Redo Size, Physical Read, Write and etc. value in units of per second and transactions per second.
765 To find out whether Load profile’s value is high or not, compare these values with older AWR reports.
For example, If Transactions count are similar but
DB Time is very high according to old , then Probably Database has Concurrency,
Lock or other similar wait events.
If Physical Read and Writes have increased , you have storage
problem or storage utilization has increased because of other factors or Your
queries are problematic and they consume extremely resources.
"DB CPU(s)" per second:

Suppose you have 34 cores into the system. So, per wall clock second you have 34 seconds to work on CPU

For above
analysis it is cleared that we don’t required any CPU servation. Because As per
AWR report it is showing DB CPU 18.6
per seconds and we have 34 cores.
Ø

Load Profile : In the load profile
section we can identify TPS(Transaction Per Second)in the database.
In the load
profile section, if the value for physical reads is much greater than logical
reads, then we need to check whether a proper value is set for sga_target (or) memory_target.
If the hard
parses value is muck bigger, increase the value for shared_pool_size parameter.
Physical read (blocks) < Logical read (blocks) then No-PROBLEM
Physical read (blocks) > Logical read (blocks then
PROBLEM

Next look at Parses and Hard parses.
If the ratio of Hard parses to Parses is high, this means Database is performing more Hard parses.
In that case we needs to look at parameters like cursor_sharing and application level for bind variables etc.
Top wait events:

“log file sync” was the top wait event with average wait of 17ms. Normally this wait event is around 8-9ms. We also noticed unusual number of SQL*net break/reset to client. I think important most part of troubleshooting is to try and relate wait events. Since “log file sync” doubled , the obvious culprit becomes our EMC storage which was not the actual case
Below are 2 different AWR (comparison/difference)
of Load Profile
1) AWR


From the load
profile, the redo size increased
from 169 to 1394,
the number of block changes increased from 1207 to 15437 which lead to conclusion that some additional unusual
activity is occurring in the database.
This became
more intriguing and complex since there was no change to apps/database. With
this clue, we drilled down further into AWR reports and identified few more
major variations.
Key Instance Activity Stats

2) AWR

Let me
summarize the above data.
- “transaction rollbacks”
increased from 281
to 322,439.
- “undo change vector size”
increased from 62.2 to 330.7
- “user commits” increase from
93K to 679K.
- “user rollbacks” remained
the same.
Here are some of the key definitions for wait events discussed in this blog
- SQL*Net break/reset : A wait
event indicating an error/unhandled exception during execution.
- User Rollbacks: Rollback
issued by application/user
- Transaction Rollbacks:
Rollbacks performed by Oracle like a transaction could not be completed
because of some constraint violation or so.
2) Instance Efficiency
Percentages:

you have to look at "% Non-Parse CPU". If
this value is near 100% means most of the CPU resources are used into
operations other than parsing, which is good for database health.
Instance
Efficiency Percentage : In this section, we can
understand the hit ratio of various sub components. Ideally, oracle recommends
to have the hit ratio greater than or equal to 90%.
If ASMM/AMM is not enabled, if the hit ratios are less than
90%, if there is a possibility, increase the values of parameters db_cache_size
and shared_pool_size.
The Parse CPU to Parse Elapsd
metric shows how much time the CPU is spending parsing SQL statements. The
lower this metric is, the better. In the following example [not quoted],
it is about 2%, which is very low. If this metric ever gets to 5%, it may mean
investigation is warranted to determine why the CPU is spending this much time
simply parsing SQL statements.”
3) Top 5 or 10 Foreground Events by Total Wait Time :
Analysis on DB CPU on top 5 Timed Foreground Events in AWR Report

1) First of all check for Wait
Class if wait class is
User I/O , System I/O, Others etc this could be fine but if wait class
has value "Concurrency"
then there could be some serious problem.
2) Next to look at is Total WaitTime (sec) which show how many times DB was
waiting in this class and then Wait
Avg (ms).
3) If Total Wait Time(s) are high but Wait Avg (ms) is low then you can ignore this.
4) If both are high
or Wait Avg (ms) is high then this has to further
investigate.
3.1. DB file scatter read : This wait
event indicates many full table scans.
Create indexes
wherever possible.
Cache small
historical tables and tune the joins.
3.2. DB file sequential read : This
wait event indicates many index scans which is quiet natural.
Wherever
possible tune the SQL code(joins).
3.3. Buffer busy / Read by other session:
This wait event indicates some blocks are busy(data block,undo block).
3.4 Log file sync : This wait event
indicates frequent commits(commit frequency is more).
-Commit more
records at a time.
-Place redo log
file in faster disks.
3.5. Free Buffer : This wait event is
because of lack of free buffers in database buffer cache.
Increase
db_cache_size parameter value.
db file
sequential read on different date: (How is it increased ?)
By comparing the AWR report of 30 June and
20 June :
The db file sequential read wait has gone up from 1ms to 3ms and correspondingly the total time waited increased from 200K to 600K.
Check the Storage and network to find the
root cause of this increase in wait time.
20 June 2016 AWR report:

30 June 2016 AWR report:

Event Waits Total Wait Time (sec) Wait
Avg(ms) % DB time Wait Class
db file sequential read 167,370,117 0
559,736 3 128.22 84.81 <<<<===== 30th June the wait time was
559,736 Total wait time (3 times more!!!!)
db file sequential read 164,188,018 0 200,566
1 126.02 74.58 <<<<===== 20th June the wait time was 200,566 Total
wait time
Snap : 30-Jun-16 11:00:25
Event Waits Total Wait Time (sec) Wait Avg(ms)
% DB time Wait Class
db file sequential read 167,370,117 559.7K 3
84.8 User I/O <<<=== Average wait of 3ms
Snap time : 20-Jun-16 11:00:50
Event Waits Total Wait Time (sec) Wait Avg(ms)
% DB time Wait Class
db file sequential read 169,406,602 155.8K 1
71.8 User I/O <<<=== Average wait of 1ms
Observation:-
DB CPU : Not all the time high DB CPU is a problem. But If you find DB CPU percentage to be very high like 80-85%, you should check the "SQL ordered by CPU Time" . Find the sql ID that makes CPU DB busy and start to look for the execution plan for any improvements on SQL.
Library cache lock : Library cache(Parse locks) are needed to maintain dependency mechanism between objects and their dependents. For example, if a column is dropped from a table then all the SQLs dependent upon table must be invalidated and reparsed during next access to that object. Library cache locks are designed to implement this tracking mechanism.
Library cache lock controls concurrency between clients in the library cache. The library cache lock acquires a lock on the object handle so that either:
There is a hidden Oracle database initialization parameter called kgl_latch_count which controls behavior in terms of the number of library cache latches created within the Oracle database.
The default value for kgl_latch_count is set to the following prime number plus value of the database initialization parameter for cpu_count. The maximum allowable value for kgl_latch_count is no greater than 66
In the event that there should be a library cache contention issue and no other recourse is available to resolve the contention with the library cache latch, this value can be increased.
Log file sync : When user session COMMITs (or rolls back), the sessions redo information needs to be written into the redo log file. The user session indicates LGWR to write all redo required from the log buffer to the redo log file. When the LGWR has finished it will indicate back to user session to confirm all redo changes are safely written on disk.
Try doing one of following:
If there are lots of short duration transactions, see if it is possible to BATCH transactions together so there are fewer distinct COMMIT operations. Each commit has to have it confirmed that the relevant REDO is on disk.
Determine whether any activity can safely be done with NOLOGGING / UNRECOVERABLE options.
Library cache mutex X : Mutexes or mutual exclusion algorithms are lighter and more granular concurrency mechanism than latches and are used in concurrent programming to avoid the simultaneous use of a common resource.This happens when many sessions tries to use/update same block. Oracle obtains mutex to ensure that certain operations are properly managed for concurrency but the management itself leads to concurrency.
Run a query against the x$kglob table to find the names of the objects being pinned most of the time.
select case when (kglhdadr = kglhdpar) then 'Parent' else 'Child '||kglobt09 end cursor,
kglhdadr ADDRESS, substr(kglnaobj,1,20) NAME, kglnahsh HASH_VALUE, kglobtyd TYPE,
kglobt23 LOCKED_TOTAL, kglobt24 PINNED_TOTAL,kglhdexc EXECUTIONS, kglhdnsp NAMESPACE
from x$kglob -- where kglobtyd != 'CURSOR'
order by kglobt24 desc)
where rownum <= 20;
If you have issues with PL/SQL packages and procedures, use dbms_shared_pool.markhot() to mark them as hot. It could also be related to any known bug from Oracle.
enq: TX - row lock contention : This is the concurrency issue between sessions. Sometimes it happens with poor application design. Try to identify the objects/SQLs participating in contention. A tuning of those SQLs may help in reducing the contention.
db file sequential read : When the db-block is not available in buffer-cache, it performs an I/O operation using indexes and places the object in buffer cache. If I/O subsystem is very fast, for example if OS can find required data in the filesystem cache, wait time will be close to zero.
If the db file sequential read is very high, you may want to engage your storage group to look for any storage bottleneck. Also, in your AWR report identify SQLs which are performing high reads from SQL Statistics section of AWR.
Apart from sequential read, Oracle also has various wait events associated with I/O. It can be any of these below.
db file scattered read : It is usually a multi-block read up to DB_FILE_MULTIBLOCK_READ_COUNT blocks. In this, data is read into multiple discontinuous locations in the memory. And that's why the word scatter.
It can happen for a table scan using index or full table scan. When performing a full table scan into the buffer cache, the blocks read are read into memory locations that are not physically adjacent to each other. For scan operations (index range scans, index fast full scans, and full-table scans), a read-ahead cache can be very useful for speeding up these "scattered read" operations.
direct path read : In a direct read, Oracle reads from a data file that bypasses the buffer cache and reads the data block directly into process-private memory.
Many of the times this wait event is misleading as, The total number of waits does not reflect the number of I/O requests. The total time spent in "direct path read" does not always reflect the true wait time. These kind of read requests are typically used for:
During heavy batch periods, waits on "direct path read" are normal. However, if the waits are significant on an OLTP style system, there may be a problem. You can,
direct path read temp : When a session reads buffers from disk directly into the PGA, the wait is on direct path read temp. It often shows up when the PGA is not able to support the size of the sorts.
If the I/O subsystem doesn’t support asynchronous I/Os, then each wait corresponds to a physical read request.
If the I/O subsystem supports asynchronous I/O, then the process overlaps read requests with processing the blocks already in the PGA. When the process attempts to access a block in the PGA that has not yet been read from disk, it issues a wait call.
Try increasing pga_aggregate_target.
direct path write temp : The "direct path write temp" wait event and "direct path write" wait event can occur when a process is writing buffers directly from PGA. The process will wait on this event for the write call to complete. Operations that could perform direct path writes include when a
Like direct path reads, the number of waits is not the same as number of write calls issued if the I/O subsystem supports asynchronous writes. The session will wait if it has processed the buffers in the PGA and can’t continue work until an I/O request completes.
Try increasing pga_aggregate_target.
free buffer wait : The free buffer wait is an Oracle metric that has generally been considered to be related to the database writer (DBWR). If the dirty blocks are not being cleared fast enough by the DBWR and some server process is reporting that it is unable to find a free buffer. This results in a free buffer wait.
A dirty buffer is one whose contents have been modified. Dirty buffers are freed for reuse once the DBWR has written the blocks to disk.
But if all the buffers are either dirty or pinned the session has to wait for a buffer to become available – either when the database writer cleans some buffers (by copying them to disc) or when some pinned buffers are finally released.
Try increasing the size of buffer cache. It could be related to Oracle Bug as well, where DBWR is unable to clean dirty buffer.
4 ) Time
Model Statistics :

DB CPU = 2065.87
DB time = 4032.03
DB Time = DB CPU + non_idle_wait_time
i.e.
non_idle_wait_time = DB Time - DB CPU
= 4032.03
- 2065.87
= 1966
seconds
the total wait time is 1966 seconds.
DB CPU
DB CPU is
Oracle server/foreground/shadow process CPU consumption. Each Oracle
server process gathers its own CPU consumption using the time and/or getrusage
C function system call.
DB CPU is taken from the actual statistic name, which is
found in both v$sess_time_model and v$sys_time_model.
Non-Idle Wait Time
When an Oracle process can not consume CPU, it will pause. As an
Oracle DBA, we know this as wait time. Sometimes a process waits and it's not a
performance problem, so we call this Idle Wait Time.
When a user is waiting for sometime to complete and way
down deep their Oracle server process is waiting to get perhaps a lock or
latch, this is Non-Idle Wait Time.

In this case SQL execute elapsed time is taking 96.43% of DB
time, which includes it sub parts like parse time elapsed, hard parse elapsed
time etc.
So, if you find Hard parse time elapsed is taking more %. So investigate further so on and so forth.

5) Operating System Statistics - Detail:
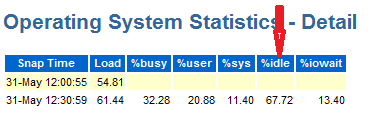
1) This report shows, system is 67% idle at time of
report taken, So, there is no resource crunch at system level.
2) But if, you found very high busy, user or sys % and indeed
this will led to low idle %
SQL Statistics
- SQL
ordered by Elapsed Time
- SQL
ordered by CPU Time
- SQL
ordered by User I/O Wait Time
- SQL
ordered by Gets
- SQL
ordered by Reads
- SQL
ordered by Physical Reads (UnOptimized)
- SQL
ordered by Executions
- SQL
ordered by Parse Calls
- SQL
ordered by Sharable Memory
- SQL
ordered by Version Count
- Complete
List of SQL Text

Execution is
High and Elapsed Time per Exec(s) Low èGood
Execution is
Low and Elapsed time per Exec(s) High èBad then
need you tune the SQL –ID
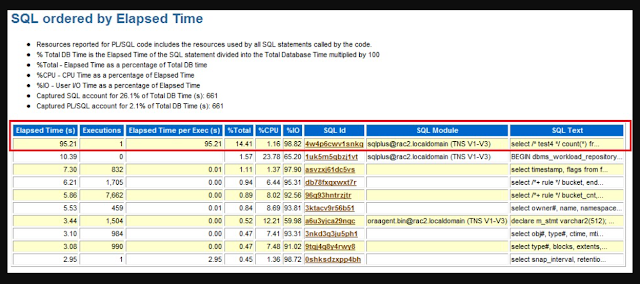
Generally we take a look of “SQL ordered by Elapsed time” section. It helps us to identify which SQL statement is taking long time to execute.
·
We have to look at Executions,
Elapsed time per Exec (s) etc. along with Elapsed time to analyze a particular
SQL statement.
·
For example, a query has low
Executions and high Elapsed time per Exec (s) and this query could be a
candidate for troubleshooting or optimizations.
Total Elapsed Time = CPU Time + Wait Time.
In Important point, if executions is 0, it doesn't means query is not executing, this might be the case when query was still executing and you took AWR report. That's why query completion was not covered in Report.
SQL Ordered by Elapsed Time Section of AWR Report Can Mislead your Analysis!!!


Test - 4 - Elapsed Time of query is 4 times of what user experiences.

Finally Interesting part is that, AWR report does not show the actual time taken by the query what user experiences. AWR Report shows Elapsed Time which is 95.2 seconds, not the user experienced time 24.41 seconds.
7) 7) SQL Ordered by CUP Time:

SQL queries are listed on the basis of CPU taken by the query
i.e. queries causing high load on the system. The top few queries could be the
candidate query for optimization.
8) SQL Order by Gets :


Note:
Question : How to find CPU consuming query in AWR report?
Ans: Go the SQL Statistics
then check the SQL order by Gets where you can find the %CPU column and its
values, if value is high then you can easily identify the SQL ID which has High
CPU
9) IO Stats in AWR:
I/O - rules of thumb
• dbfile sequential read < 5 ms
• dbfile scattered read 10 - 20ms (dependent on I/O-Size)
• log file parallel write < 5ms (into disk cache)
• dbfile parallel write < 5ms (into disk cache)


We collected the following database performance data through the Oracle database AWR report.
IOPS
Based on the 20-minute AWR reports of a test case, the IOPS is the sum of physical read total I/O requests, per Second, and physical write total I/O requests, per Second, as shown in the following figure.


Figure 37. Sample of IOPS measurement from AWR report
I/O latency
For an Oracle OLTP-style I/O workload, db file sequential read, the User I/O class wait is always the top wait event, accounting for most of the wait time. In this example, wait time averaged 0.443 milliseconds, as shown in the preceding figure.
Note: The db file sequential read events account for single block random I/O calls to the operating system.
In addition to db file sequential read wait event, transaction redo logging write is another key performance indicator for Oracle OLTP-style I/O workloads. The following figure shows the top five timed events section of the AWR report from one of the OLTP production databases while the workload ran. In this example, wait time averaged 0.244 milliseconds.

I/O MB/s throughput


Figure 39. Sample of I/O throughput in MB/s from AWR report
CPU utilization
The CPU utilization of the database nodes is shown in the OS Statistics By Instance field of the AWR report, as shown in the following figure.

RAC Wait Events:-
- GC Events
gccr multi block request – Full table or index scans
gc current multi block request – Full table or index scans
gccr block 2-way – Blocks are busy in another instance, check for block level contention or hot blocks
gccr block 3-way – Blocks are busy in another instance, check for block level contention or hot blocks
gccr block busy – Blocks are busy in another instance, check for block level contention or hot blocks
gccr block congested – cr block congestion, check for hot blocks or busy interconnect
gccr block lost – Indicates interconnect issues and contention
gc current block 2-way – Blocks are busy in another instance, check for block level contention or hot blocks
gc current block 3-way – Blocks are busy in another instance, check for block level contention or hot blocks
gc current block busy – Block is already involved in GC operation, shows hot blocks or congestion
gc current block congested – current block congestion, check for hot blocks or busy interconnect
gc current block lost - Indicates interconnect issues and contention
- Undo Events
undo segment extension – If excessive, tune undo
latch: In memory undo latch – If excessive could be bug, check for your version, may have to turn off in memory undo
wait for a undo record – Usually only during recovery of large transactions, look at turning off parallel undo recovery.
- What Next?
Determine wait events of concern
Drill down to specific sections of report for deeper analysis
Use custom scripts, ADDM and Ash to investigate issues
============================================================================================================================================
RAC Wait Events:-
- GC Events
gc current multi block request – Full table or index scans
gccr block 2-way – Blocks are busy in another instance, check for block level contention or hot blocks
gccr block 3-way – Blocks are busy in another instance, check for block level contention or hot blocks
gccr block busy – Blocks are busy in another instance, check for block level contention or hot blocks
gccr block congested – cr block congestion, check for hot blocks or busy interconnect
gccr block lost – Indicates interconnect issues and contention
gc current block 2-way – Blocks are busy in another instance, check for block level contention or hot blocks
gc current block 3-way – Blocks are busy in another instance, check for block level contention or hot blocks
gc current block busy – Block is already involved in GC operation, shows hot blocks or congestion
gc current block congested – current block congestion, check for hot blocks or busy interconnect
gc current block lost - Indicates interconnect issues and contention
- Undo Events
latch: In memory undo latch – If excessive could be bug, check for your version, may have to turn off in memory undo
wait for a undo record – Usually only during recovery of large transactions, look at turning off parallel undo recovery.
- What Next?
Drill down to specific sections of report for deeper analysis
Use custom scripts, ADDM and Ash to investigate issues
RAC Statistics
If you are running on a RAC cluster, then the AWRRPT.SQL report will provide various RAC statistics including statistics on the number of RAC instances, as well as global cache and enqueue related performance statistics. Here is an example of the RAC statistics part of the report:RAC Statistics DB/Inst: A109/a1092 Snaps: 2009-2010
Begin End
----- -----
Number of Instances: 2 2
Global Cache Load Profile
~~~~~~~~~~~~~~~~~~~~~~~~~ Per Second Per Transaction
--------------- ---------------
Global Cache blocks received: 0.11 0.52
Global Cache blocks served: 0.14 0.68
GCS/GES messages received: 0.88 4.23
GCS/GES messages sent: 0.85 4.12
DBWR Fusion writes: 0.01 0.04
Estd Interconnect traffic (KB) 2.31
Global Cache Efficiency Percentages (Target local+remote 100%)
~~~~~~~~~~~~~~~~~~~~~~~~~~~~~~~~~~~~~~~~~~~~~~~~~~~~~~~~~~~~~~
Buffer access - local cache %: 99.47
Buffer access - remote cache %: 0.53
Buffer access - disk %: 0.00
Global Cache and Enqueue Services - Workload Characteristics
~~~~~~~~~~~~~~~~~~~~~~~~~~~~~~~~~~~~~~~~~~~~~~~~~~~~~~~~~~~~
Avg global enqueue get time (ms): 0.0
Avg global cache cr block receive time (ms): 0.2
Avg global cache current block receive time (ms): 0.3
Avg global cache cr block build time (ms): 0.0
Avg global cache cr block send time (ms): 0.0
Global cache log flushes for cr blocks served %: 1.8
Avg global cache cr block flush time (ms): 4.0
Avg global cache current block pin time (ms): 0.0
Avg global cache current block send time (ms): 0.1
Global cache log flushes for current blocks served %: 0.4
Avg global cache current block flush time (ms): 0.0
Global Cache and Enqueue Services - Messaging Statistics
~~~~~~~~~~~~~~~~~~~~~~~~~~~~~~~~~~~~~~~~~~~~~~~~~~~~~~~~
Avg message sent queue time (ms): ########
Avg message sent queue time on ksxp (ms): 0.1
Avg message received queue time (ms): 4.6
Avg GCS message process time (ms): 0.0
Avg GES message process time (ms): 0.0
% of direct sent messages: 45.26
% of indirect sent messages: 31.59
% of flow controlled messages: 23.15
-------------------------------------------------------------
RAC Statistics  DB/Inst: A109/a1092  Snaps: 2009-2010

                                Begin   End
                                ----- -----
           Number of Instances:     2     2


Global Cache Load Profile
~~~~~~~~~~~~~~~~~~~~~~~~~                  Per Second       Per Transaction
                                      ---------------       ---------------
  Global Cache blocks received:                  0.11                  0.52
    Global Cache blocks served:                  0.14                  0.68
     GCS/GES messages received:                  0.88                  4.23
         GCS/GES messages sent:                  0.85                  4.12
            DBWR Fusion writes:                  0.01                  0.04
 Estd Interconnect traffic (KB)                  2.31


Global Cache Efficiency Percentages (Target local+remote 100%)
~~~~~~~~~~~~~~~~~~~~~~~~~~~~~~~~~~~~~~~~~~~~~~~~~~~~~~~~~~~~~~
Buffer access -  local cache %:   99.47
Buffer access - remote cache %:    0.53
Buffer access -         disk %:    0.00


Global Cache and Enqueue Services - Workload Characteristics
~~~~~~~~~~~~~~~~~~~~~~~~~~~~~~~~~~~~~~~~~~~~~~~~~~~~~~~~~~~~
                     Avg global enqueue get time (ms):      0.0

          Avg global cache cr block receive time (ms):      0.2
     Avg global cache current block receive time (ms):      0.3

            Avg global cache cr block build time (ms):      0.0
             Avg global cache cr block send time (ms):      0.0
      Global cache log flushes for cr blocks served %:      1.8
            Avg global cache cr block flush time (ms):      4.0

         Avg global cache current block pin time (ms):      0.0
        Avg global cache current block send time (ms):      0.1
 Global cache log flushes for current blocks served %:      0.4
       Avg global cache current block flush time (ms):      0.0

Global Cache and Enqueue Services - Messaging Statistics
~~~~~~~~~~~~~~~~~~~~~~~~~~~~~~~~~~~~~~~~~~~~~~~~~~~~~~~~
                     Avg message sent queue time (ms): ########
             Avg message sent queue time on ksxp (ms):      0.1
                 Avg message received queue time (ms):      4.6
                    Avg GCS message process time (ms):      0.0
                    Avg GES message process time (ms):      0.0

                            % of direct sent messages:    45.26
                          % of indirect sent messages:    31.59
                        % of flow controlled messages:    23.15
          -------------------------------------------------------------
Time Model Statistics
Oracle Database 10g time model related statistics are presented next. The time model allows you to see a summary of where the database is spending it's time. The report will present the various time related statistic (such as DB CPU) and how much total time was spent in the mode of operation represented by that statistic. Here is an example of the time model statistic report where we see that we spent 36.2 seconds on DB CPU time, which was a total of 60.4% of the total DB time. Note that this is a two node RAC system, so the total percentage of overall time available is 200%, not 100%.Time Model Statistics DB/Inst: A109/a1092 Snaps: 2009-2010
-> Total time in database user-calls (DB Time): 5.5s
-> Statistics including the word "background" measure background process
time, and so do not contribute to the DB time statistic
-> Ordered by % or DB time desc, Statistic name
Statistic Name Time (s) % of DB Time
------------------------------------------ ------------------ ------------
sql execute elapsed time 4.5 82.8
DB CPU 3.5 64.4
connection management call elapsed time 0.1 1.6
parse time elapsed 0.1 1.3
PL/SQL execution elapsed time 0.0 .9
hard parse elapsed time 0.0 .3
sequence load elapsed time 0.0 .1
repeated bind elapsed time 0.0 .0
DB time 5.5 N/A
background elapsed time 33.0 N/A
background cpu time 9.7 N/A
-------------------------------------------------------------
Time Model Statistics                   DB/Inst: A109/a1092  Snaps: 2009-2010
-> Total time in database user-calls (DB Time): 5.5s
-> Statistics including the word "background" measure background process
   time, and so do not contribute to the DB time statistic
-> Ordered by % or DB time desc, Statistic name

Statistic Name                                       Time (s) % of DB Time
------------------------------------------ ------------------ ------------
sql execute elapsed time                                  4.5         82.8
DB CPU                                                    3.5         64.4
connection management call elapsed time                   0.1          1.6
parse time elapsed                                        0.1          1.3
PL/SQL execution elapsed time                             0.0           .9
hard parse elapsed time                                   0.0           .3
sequence load elapsed time                                0.0           .1
repeated bind elapsed time                                0.0           .0
DB time                                                   5.5          N/A
background elapsed time                                  33.0          N/A
background cpu time                                       9.7          N/A
          -------------------------------------------------------------
Wait class and Wait Event Statistics
Closely associated with the time model section of the report are the wait class and wait event statistics sections. Within Oracle, the duration of a large number of operations (e.g. Writing to disk or to the control file) is metered. These are known as wait events, because each of these operations requires the system to wait for the event to complete. Thus, the execution of some database operation (e.g. a SQL query) will have a number of wait events associated with it. We can try to determine which wait events are causing us problems by looking at the wait classes and the wait event reports generated from AWR.Wait classes define "buckets" that allow for summation of various wait times. Each wait event is assigned to one of these buckets (for example System I/O or User I/O). These buckets allow one to quickly determine which subsystem is likely suspect in performance problems (e.g. the network, or the cluster). Here is an example of the wait class report section:Wait Class DB/Inst: A109/a1092 Snaps: 2009-2010
-> s - second
-> cs - centisecond - 100th of a second
-> ms - millisecond - 1000th of a second
-> us - microsecond - 1000000th of a second
-> ordered by wait time desc, waits desc
Avg
%Time Total Wait wait Waits
Wait Class Waits -outs Time (s) (ms) /txn
-------------------- ---------------- ------ ---------------- ------- ---------
System I/O 8,142 .0 25 3 10.9
Other 439,596 99.6 3 0 589.3
User I/O 112 .0 0 3 0.2
Cluster 443 .0 0 0 0.6
Concurrency 216 .0 0 0 0.3
Commit 16 .0 0 2 0.0
Network 3,526 .0 0 0 4.7
Application 13 .0 0 0 0.0
-------------------------------------------------------------In this report the system I/O wait class has the largest number of waits (total of 25 seconds) and an average wait of 3 milliseconds.Wait events are normal occurrences, but if a particular sub-system is having a problem performing (e.g. the disk sub-system) this fact will appear in the form of one or more wait events with an excessive duration. The wait event report then provides some insight into the detailed wait events. Here is an example of the wait event report (we have eliminated some of the bulk of this report, because it can get quite long). Note that this section is sorted by wait time (listed in microseconds). Avg
%Time Total Wait wait Waits
Event Waits -outs Time (s) (ms) /txn
---------------------------- -------------- ------ ----------- ------- ---------
control file parallel write 1,220 .0 18 15 1.6
control file sequential read 6,508 .0 6 1 8.7
CGS wait for IPC msg 422,253 100.0 1 0 566.0
change tracking file synchro 60 .0 1 13 0.1
db file parallel write 291 .0 0 1 0.4
db file sequential read 90 .0 0 4 0.1
reliable message 136 .0 0 1 0.2
log file parallel write 106 .0 0 2 0.1
lms flush message acks 1 .0 0 60 0.0
gc current block 2-way 200 .0 0 0 0.3
change tracking file synchro 59 .0 0 1 0.1In this example our control file parallel write waits (which occurs during writes to the control file) are taking up 18 seconds total, with an average wait of 15 milliseconds per wait. Additionally we can see that we have 1.6 waits per transaction (or 15ms * 1.6 per transaction = 24ms).
Wait Class                               DB/Inst: A109/a1092  Snaps: 2009-2010
-> s  - second
-> cs - centisecond -     100th of a second
-> ms - millisecond -    1000th of a second
-> us - microsecond - 1000000th of a second
-> ordered by wait time desc, waits desc

                                                                  Avg
                                       %Time       Total Wait    wait     Waits
Wait Class                      Waits  -outs         Time (s)    (ms)      /txn
-------------------- ---------------- ------ ---------------- ------- ---------
System I/O                      8,142     .0               25       3      10.9
Other                         439,596   99.6                3       0     589.3
User I/O                          112     .0                0       3       0.2
Cluster                           443     .0                0       0       0.6
Concurrency                       216     .0                0       0       0.3
Commit                             16     .0                0       2       0.0
Network                         3,526     .0                0       0       4.7
Application                        13     .0                0       0       0.0
------------------------------------------------------------- Avg
%Time Total Wait wait Waits
Event Waits -outs Time (s) (ms) /txn
---------------------------- -------------- ------ ----------- ------- ---------
control file parallel write 1,220 .0 18 15 1.6
control file sequential read 6,508 .0 6 1 8.7
CGS wait for IPC msg 422,253 100.0 1 0 566.0
change tracking file synchro 60 .0 1 13 0.1
db file parallel write 291 .0 0 1 0.4
db file sequential read 90 .0 0 4 0.1
reliable message 136 .0 0 1 0.2
log file parallel write 106 .0 0 2 0.1
lms flush message acks 1 .0 0 60 0.0
gc current block 2-way 200 .0 0 0 0.3
change tracking file synchro 59 .0 0 1 0.1Operating System Statistics
This part of the report provides some basic insight into OS performance, and OS configuration too. This report may vary depending on the OS platform that your database is running on. Here is an example from a Linux system:Statistic Total
-------------------------------- --------------------
BUSY_TIME 128,749
IDLE_TIME 1,314,287
IOWAIT_TIME 18,394
NICE_TIME 54
SYS_TIME 31,633
USER_TIME 96,586
LOAD 0
RSRC_MGR_CPU_WAIT_TIME 0
PHYSICAL_MEMORY_BYTES 3,349,528
NUM_CPUS 4
In this example output, for example, we have 4 CPU's on the box.
Statistic                                       Total
-------------------------------- --------------------
BUSY_TIME                                     128,749
IDLE_TIME                                   1,314,287
IOWAIT_TIME                                    18,394
NICE_TIME                                          54
SYS_TIME                                       31,633
USER_TIME                                      96,586
LOAD                                                0
RSRC_MGR_CPU_WAIT_TIME                              0
PHYSICAL_MEMORY_BYTES                       3,349,528
NUM_CPUS                                            4
SQL In Need of Tuning
Next in the report we find several different reports that present SQL statements that might be improved by tuning. There are a number of different reports that sort offending SQL statements by the following criteria:- Elapsed time
- CPU time
- Buffer gets
- Physical reads
- Executions
- Parse calls
- Sharable memory
- Version count
- Cluster wait time
While these reports might not help tune specific application problems, they can help you find more systemic SQL problems that you might not find when tuning a specific application module. Here is an example of the Buffer gets report: Gets CPU Elapsed
Buffer Gets Executions per Exec %Total Time (s) Time (s) SQL Id
-------------- ------------ ------------ ------ -------- --------- -------------
2,163 7 309.0 3.0 0.03 0.04 c7sn076yz7030
select smontabv.cnt, smontab.time_mp, smontab.scn, smontab.num_mappings, smon
tab.tim_scn_map, smontab.orig_thread from smon_scn_time smontab, (sel
ect max(scn) scnmax, count(*)+sum(NVL2(TIM_SCN_MAP,NUM_MAPPINGS,
0)) cnt from smon_scn_time where thread=0) smontabv where smon
1,442 721 2.0 2.0 0.05 0.05 6ssrk2dqj7jbx
select job, nvl2(last_date, 1, 0) from sys.job$ where (((:1 <= next_date) and (n
ext_date <= :2)) or ((last_date is null) and (next_date < :3))) and (field1
= :4 or (field1 = 0 and 'Y' = :5)) and (this_date is null) order by next_date, j
ob
1,348 1 1,348.0 1.9 0.04 0.04 bv1djzzmk9bv6
Module: TOAD 9.0.0.160
Select table_name from DBA_TABLES where owner = 'CDOL2_01' order by 1
1,227 1 1,227.0 1.7 0.07 0.08 d92h3rjp0y217
begin prvt_hdm.auto_execute( :db_id, :inst_id, :end_snap ); end;
896 4 224.0 1.2 0.03 0.03 6hszmvz1wjhbt
Module: TOAD 9.0.0.160
Select distinct Cons.constraint_name, cons.status, cons.table_name, cons.constra
int_type ,cons.last_change from sys.user_constraints cons where 1=1 a
nd cons.status='DISABLED'In this report we find a SQL statement that seems to be churning through 309 buffers per execution. While the execution times are not terrible we might want to look closer into the SQL statement and try to see if we could tune it (in fact this is Oracle issued SQL that we would not tune anyway).
- Elapsed time
- CPU time
- Buffer gets
- Physical reads
- Executions
- Parse calls
- Sharable memory
- Version count
- Cluster wait time
                                Gets              CPU     Elapsed
  Buffer Gets   Executions    per Exec   %Total Time (s)  Time (s)    SQL Id
-------------- ------------ ------------ ------ -------- --------- -------------
         2,163            7        309.0    3.0     0.03      0.04 c7sn076yz7030
select smontabv.cnt, smontab.time_mp, smontab.scn, smontab.num_mappings, smon
tab.tim_scn_map, smontab.orig_thread from smon_scn_time smontab, (sel
ect max(scn) scnmax, count(*)+sum(NVL2(TIM_SCN_MAP,NUM_MAPPINGS,
0)) cnt from smon_scn_time where thread=0) smontabv where smon

         1,442          721          2.0    2.0     0.05      0.05 6ssrk2dqj7jbx
select job, nvl2(last_date, 1, 0) from sys.job$ where (((:1 <= next_date) and (n
ext_date <= :2)) or ((last_date is null) and (next_date < :3))) and (field1
= :4 or (field1 = 0 and 'Y' = :5)) and (this_date is null) order by next_date, j
ob

         1,348            1      1,348.0    1.9     0.04      0.04 bv1djzzmk9bv6
Module: TOAD 9.0.0.160
Select table_name from DBA_TABLES where owner = 'CDOL2_01' order by 1

         1,227            1      1,227.0    1.7     0.07      0.08 d92h3rjp0y217
begin prvt_hdm.auto_execute( :db_id, :inst_id, :end_snap ); end;

           896            4        224.0    1.2     0.03      0.03 6hszmvz1wjhbt
Module: TOAD 9.0.0.160
Select distinct Cons.constraint_name, cons.status, cons.table_name, cons.constra
int_type ,cons.last_change from sys.user_constraints cons where 1=1 a
nd cons.status='DISABLED'Instance Activity Stats
This section provides us with a number of various statistics (such as, how many DBWR Checkpoints occurred, or how many consistent gets occurred during the snapshot). Here is a partial example of the report:Statistic Total per Second per Trans
-------------------------------- ------------------ -------------- -------------
consistent changes 9 0.0 0.0
consistent gets 70,445 19.5 94.4
consistent gets - examination 8,728 2.4 11.7
consistent gets direct 0 0.0 0.0
consistent gets from cache 70,445 19.5 94.4
cursor authentications 2 0.0 0.0
data blocks consistent reads - u 5 0.0 0.0
db block changes 1,809 0.5 2.4
db block gets 2,197 0.6 3.0
db block gets direct 0 0.0 0.0
db block gets from cache 2,033 0.6 2.7
Statistic                                     Total     per Second     per Trans
-------------------------------- ------------------ -------------- -------------
consistent changes                                9            0.0           0.0
consistent gets                              70,445           19.5          94.4
consistent gets - examination                 8,728            2.4          11.7
consistent gets direct                            0            0.0           0.0
consistent gets from cache                   70,445           19.5          94.4
cursor authentications                            2            0.0           0.0
data blocks consistent reads - u                  5            0.0           0.0
db block changes                              1,809            0.5           2.4
db block gets                                 2,197            0.6           3.0
db block gets direct                              0            0.0           0.0
db block gets from cache                      2,033            0.6           2.7
Tablespace and Data File IO Stats
The tablespace and data file IO stats report provides information on tablespace IO performance. From this report you can determine if the tablespace datafiles are suffering from sub-standard performance in terms of IO response from the disk sub-system. Here is a partial example of the tablespace report:Tablespace
------------------------------
Av Av Av Av Buffer Av Buf
Reads Reads/s Rd(ms) Blks/Rd Writes Writes/s Waits Wt(ms)
-------------- ------- ------ ------- ------------ -------- ---------- ------
SYSAUX
1 0 0.0 1.0 159 0 13 0.8
UNDOTBS2
1 0 10.0 1.0 98 0 0 0.0
SYSTEM
1 0 10.0 1.0 46 0 0 0.0
AUD
1 0 0.0 1.0 1 0 0 0.0
CDOL2_INDEX
1 0 10.0 1.0 1 0 0 0.0
CDOL_DATA
1 0 10.0 1.0 1 0 0 0.0
DBA_DEF
1 0 10.0 1.0 1 0 0 0.0
UNDOTBS1
1 0 10.0 1.0 1 0 0 0.0
USERS
1 0 10.0 1.0 1 0 0 0.0
USER_DEF
1 0 10.0 1.0 1 0 0 0.0If the tablespace IO report seems to indicate a tablespace has IO problems, we can then use the file IO stat report allows us to drill into the datafiles of the tablespace in question and determine what the problem might be. Here is an example of the File IO stat report:Tablespace Filename
------------------------ ----------------------------------------------------
Av Av Av Av Buffer Av Buf
Reads Reads/s Rd(ms) Blks/Rd Writes Writes/s Waits Wt(ms)
-------------- ------- ------ ------- ------------ -------- ---------- ------
AUD +ASM01/a109/datafile/aud.296.604081931
1 0 0.0 1.0 1 0 0 0.0
CDOL2_INDEX +ASM01/a109/datafile/cdol2_index_001.dbf
1 0 10.0 1.0 1 0 0 0.0
CDOL_DATA +ASM01/a109/datafile/cdol_data_001.dbf
1 0 10.0 1.0 1 0 0 0.0
DBA_DEF +ASM01/a109/datafile/dba_def.294.604081931
1 0 10.0 1.0 1 0 0 0.0
SYSAUX +ASM01/a109/datafile/sysaux.299.604081927
1 0 0.0 1.0 159 0 13 0.8
SYSTEM +ASM01/a109/datafile/system.301.604081919
1 0 10.0 1.0 46 0 0 0.0
UNDOTBS1 +ASM01/a109/datafile/undotbs1.300.604081925
1 0 10.0 1.0 1 0 0 0.0
UNDOTBS2 +ASM01/a109/datafile/undotbs2.292.604081931
1 0 10.0 1.0 98 0 0 0.0
USERS +ASM01/a109/datafile/users.303.604081933
1 0 10.0 1.0 1 0 0 0.0
USER_DEF +ASM01/a109/datafile/user_def.291.604081933
1 0 10.0 1.0 1 0 0 0.0
-------------------------------------------------------------
Tablespace
------------------------------
                 Av      Av     Av                       Av     Buffer Av Buf
         Reads Reads/s Rd(ms) Blks/Rd       Writes Writes/s      Waits Wt(ms)
-------------- ------- ------ ------- ------------ -------- ---------- ------
SYSAUX
             1       0    0.0     1.0          159        0         13    0.8
UNDOTBS2
             1       0   10.0     1.0           98        0          0    0.0
SYSTEM
             1       0   10.0     1.0           46        0          0    0.0
AUD
             1       0    0.0     1.0            1        0          0    0.0
CDOL2_INDEX
             1       0   10.0     1.0            1        0          0    0.0
CDOL_DATA
             1       0   10.0     1.0            1        0          0    0.0
DBA_DEF
             1       0   10.0     1.0            1        0          0    0.0
UNDOTBS1
             1       0   10.0     1.0            1        0          0    0.0
USERS
             1       0   10.0     1.0            1        0          0    0.0
USER_DEF
1 0 10.0 1.0 1 0 0 0.0Tablespace Filename
------------------------ ----------------------------------------------------
Av Av Av Av Buffer Av Buf
Reads Reads/s Rd(ms) Blks/Rd Writes Writes/s Waits Wt(ms)
-------------- ------- ------ ------- ------------ -------- ---------- ------
AUD +ASM01/a109/datafile/aud.296.604081931
1 0 0.0 1.0 1 0 0 0.0
CDOL2_INDEX +ASM01/a109/datafile/cdol2_index_001.dbf
1 0 10.0 1.0 1 0 0 0.0
CDOL_DATA +ASM01/a109/datafile/cdol_data_001.dbf
1 0 10.0 1.0 1 0 0 0.0
DBA_DEF +ASM01/a109/datafile/dba_def.294.604081931
1 0 10.0 1.0 1 0 0 0.0
SYSAUX +ASM01/a109/datafile/sysaux.299.604081927
1 0 0.0 1.0 159 0 13 0.8
SYSTEM +ASM01/a109/datafile/system.301.604081919
1 0 10.0 1.0 46 0 0 0.0
UNDOTBS1 +ASM01/a109/datafile/undotbs1.300.604081925
1 0 10.0 1.0 1 0 0 0.0
UNDOTBS2 +ASM01/a109/datafile/undotbs2.292.604081931
1 0 10.0 1.0 98 0 0 0.0
USERS +ASM01/a109/datafile/users.303.604081933
1 0 10.0 1.0 1 0 0 0.0
USER_DEF +ASM01/a109/datafile/user_def.291.604081933
1 0 10.0 1.0 1 0 0 0.0
-------------------------------------------------------------Buffer Pool Statistics
The buffer pool statistics report follows. It provides a summary of the buffer pool configuration and usage statistics as seen in this example: Free Writ Buffer
Number of Pool Buffer Physical Physical Buff Comp Busy
P Buffers Hit% Gets Reads Writes Wait Wait Waits
--- ---------- ---- -------------- ------------ ----------- ---- ---- ----------
D 64,548 100 72,465 0 355 0 0 13
-------------------------------------------------------------In this case, we have a database where all the buffer pool requests came out of the buffer pool and no physical reads were required. We also see a few (probably very insignificant in our case) buffer busy waits.
                                                            Free Writ     Buffer
     Number of Pool         Buffer     Physical    Physical Buff Comp       Busy
P      Buffers Hit%           Gets        Reads      Writes Wait Wait      Waits
--- ---------- ---- -------------- ------------ ----------- ---- ---- ----------
D       64,548  100         72,465            0         355    0    0         13
-------------------------------------------------------------Instance Recovery Stats
The instance recovery stats report provides information related to instance recovery. By analyzing this report, you can determine roughly how long your database would have required to perform crash recovery during the reporting period. Here is an example of this report:-> B: Begin snapshot, E: End snapshot
Targt Estd Log File Log Ckpt Log Ckpt
MTTR MTTR Recovery Actual Target Size Timeout Interval
(s) (s) Estd IOs Redo Blks Redo Blks Redo Blks Redo Blks Redo Blks
- ----- ----- ---------- --------- --------- ---------- --------- ------------
B 0 19 196 575 183 92160 183 N/A
E 0 19 186 258 96 92160 96 N/A
-------------------------------------------------------------
-> B: Begin snapshot,  E: End snapshot

  Targt  Estd                                  Log File Log Ckpt     Log Ckpt
  MTTR   MTTR   Recovery  Actual    Target       Size    Timeout     Interval
   (s)    (s)   Estd IOs Redo Blks Redo Blks  Redo Blks Redo Blks   Redo Blks
- ----- ----- ---------- --------- --------- ---------- --------- ------------
B     0    19        196       575       183      92160       183          N/A
E     0    19        186       258        96      92160        96          N/A
          -------------------------------------------------------------
Buffer Pool Advisory
The buffer pool advisory report answers the question, how big should you make your database buffer cache. It provides an extrapolation of the benefit or detriment that would result if you added or removed memory from the database buffer cache. These estimates are based on the current size of the buffer cache and the number of logical and physical IO's encountered during the reporting point. This report can be very helpful in "rightsizing" your buffer cache. Here is an example of the output of this report: Est
Phys
Size for Size Buffers for Read Estimated
P Est (M) Factor Estimate Factor Physical Reads
--- -------- ------ ---------------- ------ ------------------
D 48 .1 5,868 4.9 803,496
D 96 .2 11,736 4.0 669,078
D 144 .3 17,604 3.3 550,831
D 192 .4 23,472 2.8 462,645
D 240 .5 29,340 2.3 379,106
D 288 .5 35,208 1.8 305,342
D 336 .6 41,076 1.4 238,729
D 384 .7 46,944 1.2 200,012
D 432 .8 52,812 1.1 183,694
D 480 .9 58,680 1.0 172,961
D 528 1.0 64,548 1.0 165,649
D 576 1.1 70,416 1.0 161,771
D 624 1.2 76,284 1.0 159,728
D 672 1.3 82,152 1.0 158,502
D 720 1.4 88,020 1.0 157,723
D 768 1.5 93,888 0.9 157,124
D 816 1.5 99,756 0.9 156,874
D 864 1.6 105,624 0.9 156,525
D 912 1.7 111,492 0.9 156,393
D 960 1.8 117,360 0.9 155,388
-------------------------------------------------------------In this example we currently have 528GB allocated to the SGA (represented by the size factor column with a value of 1.0. It appears that if we were to reduce the memory allocated to the SGA to half of the size of the current SGA (freeing the memory to the OS for other processes) we would incur an increase of about 1.8 times the number of physical IO's in the process.
                                        Est
                                       Phys
    Size for   Size      Buffers for   Read          Estimated
P    Est (M) Factor         Estimate Factor     Physical Reads
--- -------- ------ ---------------- ------ ------------------
D         48     .1            5,868    4.9            803,496
D         96     .2           11,736    4.0            669,078
D        144     .3           17,604    3.3            550,831
D        192     .4           23,472    2.8            462,645
D        240     .5           29,340    2.3            379,106
D        288     .5           35,208    1.8            305,342
D        336     .6           41,076    1.4            238,729
D        384     .7           46,944    1.2            200,012
D        432     .8           52,812    1.1            183,694
D        480     .9           58,680    1.0            172,961
D        528    1.0           64,548    1.0            165,649
D        576    1.1           70,416    1.0            161,771
D        624    1.2           76,284    1.0            159,728
D        672    1.3           82,152    1.0            158,502
D        720    1.4           88,020    1.0            157,723
D        768    1.5           93,888    0.9            157,124
D        816    1.5           99,756    0.9            156,874
D        864    1.6          105,624    0.9            156,525
D        912    1.7          111,492    0.9            156,393
D        960    1.8          117,360    0.9            155,388
-------------------------------------------------------------PGA Reports
The PGA reports provide some insight into the health of the PGA. The PGA Aggr Target Stats report provides information on the configuration of the PGA Aggregate Target parameter during the reporting period.The PGA Aggregate Target Histogram report provides information on the size of various operations (e.g. sorts). It will indicate if PGA sort operations occurred completely in memory, or if some of those operations were written out to disk.Finally the PGA Memory Advisor, much like the buffer pool advisory report, provides some insight into how to properly size your PGA via the PGA_AGGREGATE_TARGET database parameter. The PGA Memory Advisor report is shown here: Estd Extra Estd PGA Estd PGA
PGA Target Size W/A MB W/A MB Read/ Cache Overalloc
Est (MB) Factr Processed Written to Disk Hit % Count
---------- ------- ---------------- ---------------- -------- ----------
44 0.1 289,899.2 7,844.9 97.0 1,124
88 0.3 289,899.2 7,576.9 97.0 1,073
176 0.5 289,899.2 3.3 100.0 0
263 0.8 289,899.2 3.3 100.0 0
351 1.0 289,899.2 3.3 100.0 0
421 1.2 289,899.2 0.0 100.0 0
491 1.4 289,899.2 0.0 100.0 0
562 1.6 289,899.2 0.0 100.0 0
632 1.8 289,899.2 0.0 100.0 0
702 2.0 289,899.2 0.0 100.0 0
1,053 3.0 289,899.2 0.0 100.0 0
1,404 4.0 289,899.2 0.0 100.0 0
2,106 6.0 289,899.2 0.0 100.0 0
2,808 8.0 289,899.2 0.0 100.0 0
-------------------------------------------------------------
                                       Estd Extra    Estd PGA   Estd PGA
PGA Target    Size           W/A MB   W/A MB Read/      Cache  Overalloc
  Est (MB)   Factr        Processed Written to Disk     Hit %      Count
---------- ------- ---------------- ---------------- -------- ----------
        44     0.1        289,899.2          7,844.9     97.0      1,124
        88     0.3        289,899.2          7,576.9     97.0      1,073
       176     0.5        289,899.2              3.3    100.0          0
       263     0.8        289,899.2              3.3    100.0          0
       351     1.0        289,899.2              3.3    100.0          0
       421     1.2        289,899.2              0.0    100.0          0
       491     1.4        289,899.2              0.0    100.0          0
       562     1.6        289,899.2              0.0    100.0          0
       632     1.8        289,899.2              0.0    100.0          0
       702     2.0        289,899.2              0.0    100.0          0
     1,053     3.0        289,899.2              0.0    100.0          0
     1,404     4.0        289,899.2              0.0    100.0          0
     2,106     6.0        289,899.2              0.0    100.0          0
     2,808     8.0        289,899.2              0.0    100.0          0
          -------------------------------------------------------------
Shared Pool Advisory
The shared pool advisory report provides assistance in right sizing the Oracle shared pool. Much like the PGA Memory Advisor or the Buffer Pool advisory report, it provides some insight into what would happen should you add or remove memory from the shared pool. This can help you reclaim much needed memory if you have over allocated the shared pool, and can significantly improve performance if you have not allocated enough memory to the shared pool. Here is an example of the shared pool advisory report: Est LC Est LC Est LC Est LC
Shared SP Est LC Time Time Load Load Est LC
Pool Size Size Est LC Saved Saved Time Time Mem
Size(M) Factr (M) Mem Obj (s) Factr (s) Factr Obj Hits
---------- ----- -------- ------------ ------- ------ ------- ------ -----------
192 .4 54 3,044 ####### .8 ####### 382.1 22,444,274
240 .5 92 5,495 ####### .9 ####### 223.7 22,502,102
288 .6 139 8,122 ####### .9 53,711 102.5 22,541,782
336 .7 186 12,988 ####### 1.0 17,597 33.6 22,562,084
384 .8 233 17,422 ####### 1.0 7,368 14.1 22,569,402
432 .9 280 23,906 ####### 1.0 3,553 6.8 22,571,902
480 1.0 327 28,605 ####### 1.0 524 1.0 22,573,396
528 1.1 374 35,282 ####### 1.0 1 .0 22,574,164
576 1.2 421 40,835 ####### 1.0 1 .0 22,574,675
624 1.3 468 46,682 ####### 1.0 1 .0 22,575,055
672 1.4 515 52,252 ####### 1.0 1 .0 22,575,256
720 1.5 562 58,181 ####### 1.0 1 .0 22,575,422
768 1.6 609 64,380 ####### 1.0 1 .0 22,575,545
816 1.7 656 69,832 ####### 1.0 1 .0 22,575,620
864 1.8 703 75,168 ####### 1.0 1 .0 22,575,668
912 1.9 750 78,993 ####### 1.0 1 .0 22,575,695
960 2.0 797 82,209 ####### 1.0 1 .0 22,575,719
-------------------------------------------------------------
                                        Est LC Est LC  Est LC Est LC
    Shared    SP   Est LC                 Time   Time    Load   Load      Est LC
      Pool  Size     Size       Est LC   Saved  Saved    Time   Time         Mem
   Size(M) Factr      (M)      Mem Obj     (s)  Factr     (s)  Factr    Obj Hits
---------- ----- -------- ------------ ------- ------ ------- ------ -----------
       192    .4       54        3,044 #######     .8 #######  382.1  22,444,274
       240    .5       92        5,495 #######     .9 #######  223.7  22,502,102
       288    .6      139        8,122 #######     .9  53,711  102.5  22,541,782
       336    .7      186       12,988 #######    1.0  17,597   33.6  22,562,084
       384    .8      233       17,422 #######    1.0   7,368   14.1  22,569,402
       432    .9      280       23,906 #######    1.0   3,553    6.8  22,571,902
       480   1.0      327       28,605 #######    1.0     524    1.0  22,573,396
       528   1.1      374       35,282 #######    1.0       1     .0  22,574,164
       576   1.2      421       40,835 #######    1.0       1     .0  22,574,675
       624   1.3      468       46,682 #######    1.0       1     .0  22,575,055
       672   1.4      515       52,252 #######    1.0       1     .0  22,575,256
       720   1.5      562       58,181 #######    1.0       1     .0  22,575,422
       768   1.6      609       64,380 #######    1.0       1     .0  22,575,545
       816   1.7      656       69,832 #######    1.0       1     .0  22,575,620
       864   1.8      703       75,168 #######    1.0       1     .0  22,575,668
       912   1.9      750       78,993 #######    1.0       1     .0  22,575,695
       960   2.0      797       82,209 #######    1.0       1     .0  22,575,719
          -------------------------------------------------------------
SGA Target Advisory
The SGA target advisory report is somewhat of a summation of all the advisory reports previously presented in the AWR report. It helps you determine the impact of changing the settings of the SGA target size in terms of overall database performance. The report uses a value called DB Time as a measure of the increase or decrease in performance relative to the memory change made. Also the report will summarize an estimate of physical reads associated with the listed setting for the SGA. Here is an example of the SGA target advisory report:SGA Target SGA Size Est DB Est Physical
Size (M) Factor Time (s) Reads
---------- ---------- ------------ ----------------
528 0.5 25,595 769,539
792 0.8 20,053 443,095
1,056 1.0 18,443 165,649
1,320 1.3 18,354 150,476
1,584 1.5 18,345 148,819
1,848 1.8 18,345 148,819
2,112 2.0 18,345 148,819In this example, our SGA Target size is currently set at 1056MB. We can see from this report that if we increased the SGA target size to 2112MB, we would see almost no performance improvement (about a 98 second improvement overall). In this case, we may determine that adding so much memory to the database is not cost effective, and that the memory can be better used elsewhere.
SGA Target   SGA Size       Est DB     Est Physical
  Size (M)     Factor     Time (s)            Reads
---------- ---------- ------------ ----------------
       528        0.5       25,595          769,539
       792        0.8       20,053          443,095
     1,056        1.0       18,443          165,649
     1,320        1.3       18,354          150,476
     1,584        1.5       18,345          148,819
     1,848        1.8       18,345          148,819
2,112 2.0 18,345 148,819Memory Advisory
Memory advisory reports for the streams pool and the java pool also appear in the report (assuming you are using the streams pool). These reports take on the same general format as the other memory advisor reports.
Buffer Wait Statistics
The buffer wait statistics report helps you drill down on specific buffer wait events, and where the waits are occurring. In the following report we find that the 13 buffer busy waits we saw in the buffer pool statistics report earlier are attributed to data block waits. We might then want to pursue tuning remedies to these waits if the waits are significant enough. Here is an example of the buffer wait statistics report:Class Waits Total Wait Time (s) Avg Time (ms)
------------------ ----------- ------------------- --------------
data block 13 0 1
Class                    Waits Total Wait Time (s)  Avg Time (ms)
------------------ ----------- ------------------- --------------
data block                  13                   0              1
Enqueue Activity
The Enqueue activity report provides information on enqueues (higher level Oracle locking) that occur. As with other reports, if you see high levels of wait times in these reports, you might dig further into the nature of the enqueue and determine the cause of the delays. Here is an example of this report section:Enqueue Type (Request Reason)
------------------------------------------------------------------------------
Requests Succ Gets Failed Gets Waits Wt Time (s) Av Wt Time(ms)
------------ ------------ ----------- ----------- ------------ --------------
PS-PX Process Reservation
386 358 28 116 0 .43
US-Undo Segment
276 276 0 228 0 .18
TT-Tablespace
90 90 0 42 0 .71
WF-AWR Flush
12 12 0 7 0 1.43
MW-MWIN Schedule
2 2 0 2 0 5.00
TA-Instance Undo
12 12 0 12 0 .00
UL-User-defined
7 7 0 7 0 .00
CF-Controlfile Transaction
5,737 5,737 0 5 0 .00
Enqueue Type (Request Reason)
------------------------------------------------------------------------------
    Requests    Succ Gets Failed Gets       Waits  Wt Time (s) Av Wt Time(ms)
------------ ------------ ----------- ----------- ------------ --------------
PS-PX Process Reservation
         386          358          28         116            0            .43
US-Undo Segment
         276          276           0         228            0            .18
TT-Tablespace
          90           90           0          42            0            .71
WF-AWR Flush
          12           12           0           7            0           1.43
MW-MWIN Schedule
           2            2           0           2            0           5.00
TA-Instance Undo
          12           12           0          12            0            .00
UL-User-defined
           7            7           0           7            0            .00
CF-Controlfile Transaction
       5,737        5,737           0           5            0            .00
Undo Segment Summary
The undo segment summary report provides basic information on the performance of undo tablespaces.
Latch Activity
The latch activity report provides information on Oracle's low level locking mechanism called a latch. From this report you can determine if Oracle is suffering from latching problems, and if so, which latches are causing the greates amount of contention on the system. Here is a partial example of the latch activity report (it is quite long): Pct Avg Wait Pct
Get Get Slps Time NoWait NoWait
Latch Name Requests Miss /Miss (s) Requests Miss
------------------------ -------------- ------ ------ ------ ------------ ------
ASM allocation 122 0.0 N/A 0 0 N/A
ASM map headers 60 0.0 N/A 0 0 N/A
ASM map load waiting lis 11 0.0 N/A 0 0 N/A
ASM map operation freeli 30 0.0 N/A 0 0 N/A
ASM map operation hash t 45,056 0.0 N/A 0 0 N/A
ASM network background l 1,653 0.0 N/A 0 0 N/A
AWR Alerted Metric Eleme 14,330 0.0 N/A 0 0 N/A
Consistent RBA 107 0.0 N/A 0 0 N/A
FAL request queue 75 0.0 N/A 0 0 N/A
FAL subheap alocation 75 0.0 N/A 0 0 N/A
FIB s.o chain latch 14 0.0 N/A 0 0 N/A
FOB s.o list latch 93 0.0 N/A 0 0 N/A
JS broadcast add buf lat 826 0.0 N/A 0 0 N/A
JS broadcast drop buf la 826 0.0 N/A 0 0 N/AIn this example our database does not seem to be experiencing any major latch problems, as the wait times on the latches are 0, and our get miss pct (Pct Get Miss) is 0 also.There is also a latch sleep breakdown report which provides some additional detail if a latch is being constantly moved into the sleep cycle, which can cause additional performance issues.The latch miss sources report provides a list of latches that encountered sleep conditions. This report can be of further assistance when trying to analyze which latches are causing problems with your database.
                                           Pct    Avg   Wait                 Pct
                                    Get    Get   Slps   Time       NoWait NoWait
Latch Name                     Requests   Miss  /Miss    (s)     Requests   Miss
------------------------ -------------- ------ ------ ------ ------------ ------
ASM allocation                      122    0.0    N/A      0            0    N/A
ASM map headers                      60    0.0    N/A      0            0    N/A
ASM map load waiting lis             11    0.0    N/A      0            0    N/A
ASM map operation freeli             30    0.0    N/A      0            0    N/A
ASM map operation hash t         45,056    0.0    N/A      0            0    N/A
ASM network background l          1,653    0.0    N/A      0            0    N/A
AWR Alerted Metric Eleme         14,330    0.0    N/A      0            0    N/A
Consistent RBA                      107    0.0    N/A      0            0    N/A
FAL request queue                    75    0.0    N/A      0            0    N/A
FAL subheap alocation                75    0.0    N/A      0            0    N/A
FIB s.o chain latch                  14    0.0    N/A      0            0    N/A
FOB s.o list latch                   93    0.0    N/A      0            0    N/A
JS broadcast add buf lat            826    0.0    N/A      0            0    N/A
JS broadcast drop buf la 826 0.0 N/A 0 0 N/ASegments by Logical Reads and Segments by Physical Reads
The segments by logical reads and segments by physical reads reports provide information on the database segments (tables, indexes) that are receiving the largest number of logical or physical reads. These reports can help you find objects that are "hot" objects in the database. You may want to review the objects and determine why they are hot, and if there are any tuning opportunities available on those objects (e.g. partitioning), or on SQL accessing those objects.For example, if an object is showing up on the physical reads report, it may be that an index is needed on that object. Here is an example of the segments by logical reads report:Segments by Logical Reads DB/Inst: A109/a1092 Snaps: 2009-2010
-> Total Logical Reads: 72,642
-> Captured Segments account for 96.1% of Total
Tablespace Subobject Obj. Logical
Owner Name Object Name Name Type Reads %Total
---------- ---------- -------------------- ---------- ----- ------------ -------
SYS SYSAUX SYS_IOT_TOP_8813 INDEX 52,192 71.85
SYS SYSTEM SMON_SCN_TIME TABLE 4,704 6.48
SYS SYSTEM I_JOB_NEXT INDEX 2,432 3.35
SYS SYSTEM OBJ$ TABLE 1,344 1.85
SYS SYSTEM TAB$ TABLE 1,008 1.39
-------------------------------------------------------------
Segments by Logical Reads               DB/Inst: A109/a1092  Snaps: 2009-2010
-> Total Logical Reads:          72,642
-> Captured Segments account for   96.1% of Total

           Tablespace                      Subobject  Obj.       Logical
Owner         Name    Object Name            Name     Type         Reads  %Total
---------- ---------- -------------------- ---------- ----- ------------ -------
SYS        SYSAUX     SYS_IOT_TOP_8813                INDEX       52,192   71.85
SYS        SYSTEM     SMON_SCN_TIME                   TABLE        4,704    6.48
SYS        SYSTEM     I_JOB_NEXT                      INDEX        2,432    3.35
SYS        SYSTEM     OBJ$                            TABLE        1,344    1.85
SYS        SYSTEM     TAB$                            TABLE        1,008    1.39
          -------------------------------------------------------------
Additional Reports
Several segment related reports appear providing information on:- Segments with ITL waits
- Segments with Row lock waits
- Segments with buffer busy waits
- Segments with global cache buffer waits
- Segments with CR Blocks received
- Segments with current blocks received
These reports help provide more detailed information on specific segments that might be experiencing performance problems.The dictionary cache and library cache statistics reports provide performance information on the various areas in the data dictionary cache and the library cache.The process memory summary, SGA memory summary, and the SGA breakdown difference reports provide summary information on how memory allocated to the database is allocated amongst the various components. Other memory summary reports may occur if you have certain optional components installed (such as streams).The database parameter summary report provides a summary of the setting of all the database parameters during the snapshot report. If the database parameters changed during the period of the report, then the old and new parameters will appear on the report.
- Segments with ITL waits
- Segments with Row lock waits
- Segments with buffer busy waits
- Segments with global cache buffer waits
- Segments with CR Blocks received
- Segments with current blocks received

No comments:
Post a Comment