Global Cache Service (GCS)

Oracle block “master”.
Oracle RAC block master:
• The master can be thought of as the directory node for a block or an object.
• The global state of the data block – whether it is cached or on disk, which instances have the blocks cached and whether the blocks can be shared immediately or has modification pending - is completely known at the master.


Common Problems and Symptoms
• “Lost Blocks”: Interconnect or Switch Problems.
• Slow or bottlenecked disks: one node becomes a bottleneck, entire cluster waits.
• System load and scheduling: high CPU – “frozen” LMS processes.
• Contention: frequent access to same resources.
• Unexpectedly high latencies: network issues.
Best practice #1: Tune the interconnect
• Dropped packets/fragments
• Buffer overflows / high load on NICs.
• Packet reassembly failures or timeouts
• TX/RX errors
• Verify low utilization
“Lost Blocks”: NIC Receive Errors
ifconfig –a:
eth0 Link encap:Ethernet HWaddr 00:0B:DB:4B:A2:04
inet addr:130.35.25.110 Bcast:130.35.27.255 Mask:255.255.252.0
UP BROADCAST RUNNING MULTICAST MTU:1500 Metric:1
RX packets:21721236 errors:135 dropped:0 overruns:0 frame:95
TX packets:273120 errors:0 dropped:0 overruns:0 carrier:0
…
Overruns indicates that NIC internal buffers should be increased while dropped may indicate that the driver and OS layers cannot drain the queued messages fast enough.


Latency probes for different message sizes
Exact throughput measurements (not shown)
Send and receive errors, dropped packets (not shown )
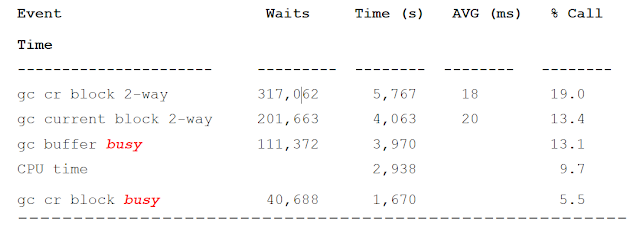
Interconnect latency

Expected: To see 2-way, 3-way
Unexpected: To see > 1 ms (AVG ms should be around 1 ms)
Cause: high load, slow interconnect, contention…
Tackle latency first, then tackle busy events
Cache Fusion messaging traffic

Network traffic received = Global Cache blocks received * DB block size =
4.3 * 8192 = .01 Mb/sec
Network traffic generated = Global Cache blocks served * DB block size =
23.44 * 8192 = .20 Mb/sec
What to do?
• Dedicated interconnect NICs and switches.
• Tune IPC buffer sizes
• Ensure enough OS resources available
• Spinning process can consume all network ports
• Disable any firewall on interconnect
• Use “Jumbo Frames” where supported.
• Make sure network utilization is low (20%).
Best practice #2: I/O is critical to RAC
Storage is global to the cluster and a single badly behaving node or badly
balanced disk configuration can affect the entire disk read and write
performance of all nodes.
Log flush IO delays can cause “busy” buffers:
LGWR always writes before block changes ownership.
LGWR bad latency – bad overall RAC performance.
• “Bad” queries on one node can saturate a disk where the redo logs are located.
• IO is issued from ALL nodes to shared storage.
Cluster-Wide I/O Impact

1. IO on disk group containing redo logs is bottlenecked.
2. Block shipping for hot blocks is delayed by log flush IO.
3. Serialization/Queues build up.
Drill-down on node 2: An IO capacity problem

After “killing” the session…

1. Log file writes are normal
2. Global serialization has disappeared
What to do?
• Tune IO layout – RAC much more sensitive to full table scans / full index scans / etc…
• Tune queries consuming a lot of IO.
• One busy node can affect the entire cluster.
• Separate storage of redo log files and data files.
• Make sure Async I/O is enabled!
Best practice #3: single node CPU load matters
If an LMS is not able to be scheduled in order to process messages which have arrived in its request queue, the time in the run queue adds to the data access time for users on other nodes.
Best practice #4: avoid block contention
• Any frequently accessed data may have hotspots which are sensitive to how may users are accessing the same data concurrently.
• Its is very likely that CR BLOCK BUSY and GC BUFFER BUSY are related.
• RAC can magnify a resource bottleneck.
• Identify “hot” blocks and reduce concurrency.
• If possible – “partition” application workload.
Best practice #5: Smart application design
• No fundamentally different design and coding practices for RAC.
BUT:
• Flaws in execution or design have higher impact in RAC
• Performance and scalability in RAC will be more sensitive to bad plans or bad schema design
• Serializing contention makes applications less scalable.
• Standard SQL and schema tuning solves > 80% of performance problems
Major scalability pitfalls
• Serializing contention on a small set of data/index blocks
• monotonically increasing index (sequence numbers) – not scalable when
index modified from all nodes.
• frequent updates of small cached tables (“hot blocks”).
• Sparse blocks ( PCTFREE 99 ) will reduce serialization
• Concurrent DDL and DML (frequent invalidation of cursors = many data
dictionary reads and syncs).
• Segment without automatic segment space management (ASSM) or Free
List Group (FLG).
• Sequence caching


No comments:
Post a Comment