1. Beware of top event tunnel vision.
2. Eliminate infrastructure as an issue.
3. Identify problem instance(s).
4. Review Send side metrics, and not just Receive side metrics.
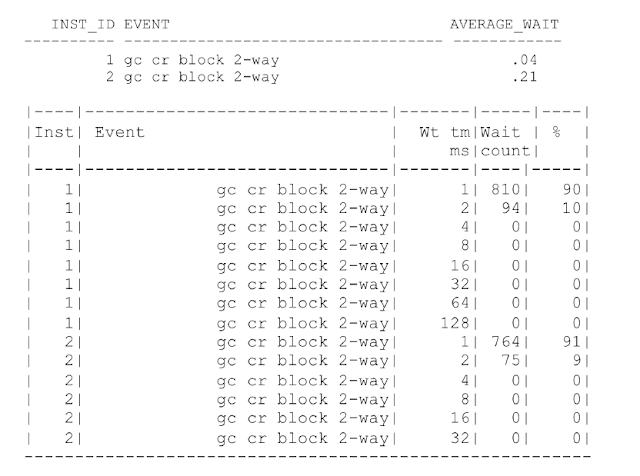
5. Use histograms to identify any abnormalities, and not just averages.
Top event tunnel vision
In RAC, the root cause can be hidden in other node and might not show up in the Top-5 wait events.
Impact of side effect events can be much, much worse then actual root cause event itself.
Performance of the instances are intertwined.
Performance of background processes in one node, can affect the application performance in the all other nodes.
Example 1

Example 2

Example 3 (continued)

gc buffer busy

Event ‘gc buffer busy [acquire|release]’ can be the symptoms for all the RAC performance root causes discussed earlier.
Gc buffer busy wait simply means that there is a pending request for a BL lock for that block already.
All other process wait for the BL lock to be available and charge the time to gc buffer busy event.
ASH or trace files can be used to identify the blocks suffering from excessive ‘gc buffer busy’ waits.
Only use this method if there is no other issue affecting background processes.
To understand gc buffer busy waits:
-> Identify the object and object type
-> Identify the block type
ash_gcwait_to_obj.sql can be used to identify the object name and type.
Gc buffer busy – Identify object


Gc buffer busy – Identify block type
You might need to dump the block to identify the type and contents of the block.
alter system dump datafile 4 block min 103582 block max 103582;
In this example, it is a leaf block of an index.


2. Eliminate infrastructure as an issue.
Eliminate infra-structure as an issue
Wait events ‘gc cr block 2-way’ , ‘gc cr block 3-way’ , ‘gc current block 2-way’, and ‘gc current block 3-way’, ‘gc cr grant 2-way’, ‘gc cr grant 2-way’.
Concurrency or congestion issues are not factored in to these events.
The lowest wait time that you can possibly get for a block or a message transfer.
A wait time of <2ms is normal. In Exadata, <0.5ms
3. Identify problem instance(s).
Gv$instance_cache_transfer keeps track of the RX metrics at both instance and class level.

Identify problem inducing instance
SELECT INSTANCE ||'->’ || inst_id transfer,
class, cr_block cr_blk,
Trunc(cr_block_time / cr_block / 1000, 2) avg_Cr,
current_block cur_blk,
Trunc(current_block_time / current_block / 1000, 2) avg_cur
FROM gv$instance_cache_transfer
WHERE cr_block > 0 AND current_block > 0
ORDER BY INSTANCE, inst_id, class
/

4. Review Send side metrics, and not just
Receive side metrics.
Sending side analysis
gc cr block receive time=
Time to send message to a remote LMS process by FG
+ Time taken by LMS to build block (statistics: gc cr block build time)
+ LMS wait for LGWR latency ( statistics: gc cr block flush time)
+ LMS send time (Statistics: gc cr block send time)
+ Wire latency.


Problem node


No comments:
Post a Comment