Recently I performed a failover of my Oracle database (running on Linux) to my standby database, and after the switchover, application team started complaining about extreme slowness. I was using OEM Cloud Control and the graph was showing high waits for “free buffer wait” and alert log started showing Checkpoint not Complete. Since I never saw these waits on my previous primary server (now standby), so first thing came into my mind was that the disks on the standby server (now primary) are probably very slow, because hardware of my servers was very old. Servers also had internal disks (not SAN or NAS). I generated AWR report for the time when database was running fine and without any performance issue, and then a latest time report based on latest snapshots to see what is going wrong with the IO.
In the following I will show a comparison of both AWR reports (good time and bad time) and explain how to check IO related issues in AWR reports. In the end, I will also explain that despite slow disks/IO, how I was able to solve the latency issue. AWR snapshot interval was set to 30 minutes for this case.
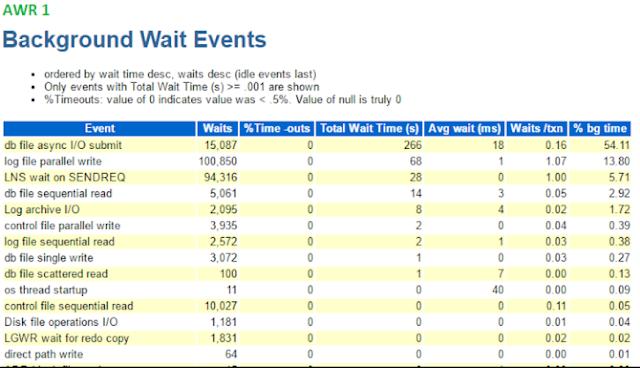
Left portion (AWR 1, with green caption) of following images is form the time when database was running on the primary node without any disk IO latency issue.
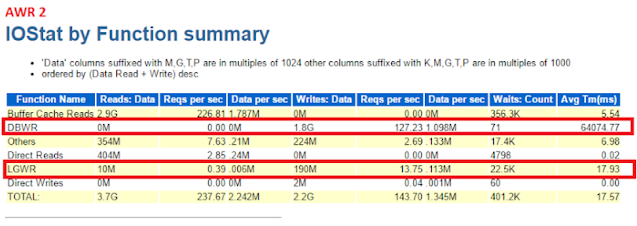
Right portion (AWR 2, with red caption) is when database was running on standby host (after the switchover), and this standby host had disk IO latency issues.
In the first section of AWR report we don’t see much difference in load profile that would need our attention to investigate IO latency.
Next, we compare instance efficiency and 10 foreground wait events. During performance issue time, Buffer Hit % seems to be higher than “good” time, but it can be ignored.
Next alarming thing that is showing is “free buffer waits” event at the top in the right side AWR, and this is first sign of disk IO latency (we will confirm it later).
Because of slow IO, DBWR was not fast enough in cleaning the buffer cache (moving dirty blocks from the buffer cache to the data files to make room for new data blocks to be cached).
“Configuration” can also be seen listed as the top wait class, to which “free buffer waits” event belongs to. “free buffer waits” was the wait event causing application to respond very slow.
In the following section of AWR, we see Foreground Wait Events.
We can easily identify latency in the disk IO because average wait (milliseconds) is quite high in AWR 2 as compared to the AWR 1 for IO related wait events.
In the following section of AWR, background wait events related to IO are also showing extensively high wait time in AWR 2
Lastly, let’s have a look at the IO Stat section of both AWR reports. We can see that writing by database writer (DBWR) process and log writer (LGWR) is very much slow in AWR 2.
Last column shows value in milliseconds each of these processes waited on average.
Once it is identified that IO is very slow, the disks/storage needs to be replaced (or latest firmware installation sometimes helps). If it cannot be done immediately, we can check for some alternatives as a temporary solution.
In my case, I got to know that FILESYSTEMIO_OPTIONS parameter was set to NONE (although Oracle recommends setting it to “SETALL”). Setting this parameter to NONE means that asynchronous IO is not enabled for the file system. I set this value to SETALL and after that I observed that performance of IO has got better and I can survive until we switchover back to the primary, or replace the disks of this server.


No comments:
Post a Comment